Title (including place, country name and type of disease outbreak)
Number of situation report:
Date (including epidemiological week):
Executive Summary or Highlights
Brief description of the main findings, outbreak response activities (case management, water, sanitation and hygiene, surveillance, coordination and logistics), conclusions and recommendations for the period covered by the report.
Background
- Description of the alert
- Outbreak confirmation of first cases
- Current areas affected and population at risk
- First response activities
Situation Update
a) Epidemiology (figures, tables and maps)
- Number of new and cumulative number of suspected cholera cases and deaths by week and by administrative area
| Epi Week | District | Date of onset of outbreak | New cases on current week | New deaths on current week | Cumulative suspected cases | Cumulative deaths |
| 1 | District 1 | dd/mm/yyyy | ||||
| 1 | District 2 | dd/mm/yyyy | ||||
|
1 |
District 3 | dd/mm/yyyy | ||||
| 1 | District 4 | dd/mm/yyyy | ||||
| Total Cases | ||||||
- Number of confirmed cases per week and per administrative area – example:
| Epi Week | District | CTU/CTC | Samples sent on current week | Culture/PCR positive | Culture/PCR negative | Samples tested |
| 1 | District 1 | CTU/CTC A | ||||
| 1 | District 2 | CTU/CTC B | ||||
|
1 |
District 3 | CTU/CTC C | ||||
| 1 | District 4 | CTU/CTC D | ||||
| 1 | District 5 | CTU/CTC E |
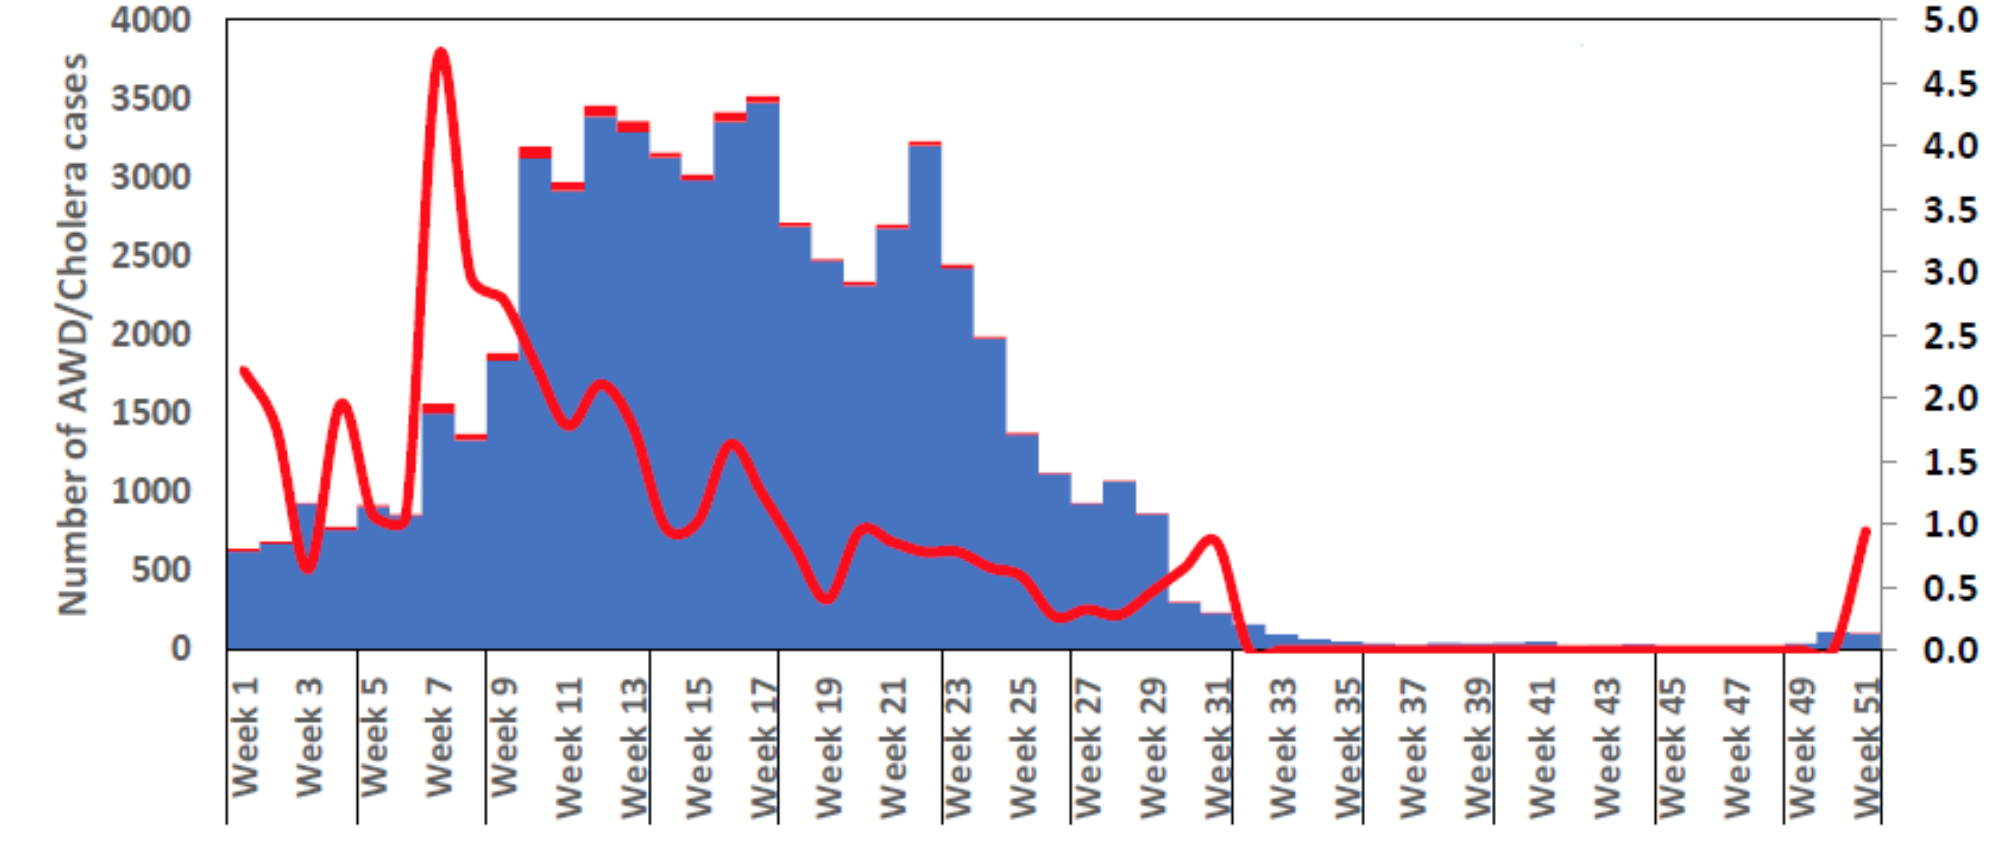
- Graph number of cases and deaths over time (epidemic curve) with case fatality rate (CFR) line (in all districts combined and by each district/administrative area).

- Map showing the distribution of cases by geographical locations
- Other tables or graphs:
- AR (overall and by affected area)
- New alerts and investigations conducted
- CFR (overall and by affected area)
- Weekly incidence rate (overall and by affected area)
b) Case management activities
- Number of CTU/CTC and oral rehydration points (ORPs) established and operational
- Capacity of CTU/CTC (number of beds, number of health staff)
- Mapping of CTU/CTC and ORP where possible
c) Community activities, by area (such as provision of safe water, health and hygiene education):
- Assessment conducted in the reporting period
- Mapping of the interventions
- Estimated coverage (%) of programmes in targeted populations
d) OCV conducted or planned
e) Coordination and leadership of the response
- Partners involved (NGO, international agencies, etc.).
- Deployment of experts and international staff.
f) Logistics and supplies
- Mobilization of supplies/logistics
g) Constraints, challenges, priority needs
h) Contact information
- Name, email and telephone


